User Manual - ePowerMonitor PRO
Table of Contents
PART 1 - Accessing & using the platform
Upon successful installation of all equipment, including Elum’s controller/ datalogger, and after configuring the internet connection and completing commissioning tests, Elum Energy support will grant the client access to the online monitoring platform.
The client will receive their login User ID and Password within a few days following the system implementation.
1. Login details
To access ePowerMonitor, you will need the credentials provided by Elum support after the commissioning of Elum equipment, specifically the User ID and password.
The platform can be accessed:
- Directly from any web browser using the following link: https://epm.elum-energy.com
- Or from the Elum Energy website through the “Connect to ePM” located in the yellow ribbon at the top of the screen.
For easy access in the future, we recommend adding this link to your browser’s bookmarks.
After selecting one of the two methods mentioned earlier to access the platform, you will be directed to the login page.
Enter your e-mail address and password and click “Log in”.
If you have not received your user IDs within a few days after system commissioning, please contact Customer Service Elum Energy.
password?” and following the provided instructions. You will need access to the email address linked to your ePowerMonitor account.
Please refer to Section 1 of Part 2. for instructions on changing your password.
First Log In?
For your initial login to ePowerMonitor, use the credentials provided by the Elum support team. These credentials include the email address you initially provided to support and the password generated by the team. After your first login, you can access your account.
Instruction on how to change your password is provided in Section 1 of Part 2 of this manual.
2. Home Page
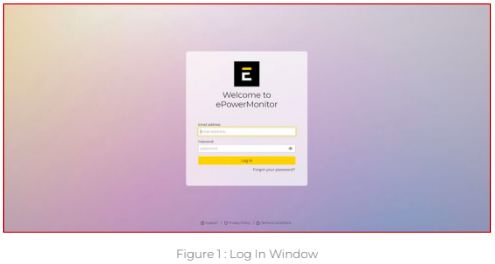
After entering your login credentials and clicking “Log In” you will be redirected to a selection page where you can choose the appropriate version of the platform based on your site access. The options displayed will depend on the type of subscription associated with your account.
- Lite sites only: If your account is linked exclusively to Lite sites, you will see a button labeled “Go to Lite” Click this to access the Lite version of the platform.
- Pro sites only: If your account is associated only with Pro sites, the page will display a “Go to Pro” button. Select this to proceed to the Pro version of the platform.
- Both Lite and Pro sites: If your account has access to both Lite and Pro sites, you will be presented with two buttons: “Go to Lite” and “Go to Pro” Choose the appropriate option based on the version you wish to use
3. Site Overview Page
Global Presentation
Once you select the version of the platform, you will be immediately redirected to the Site Overview, where all the installed sites you have permission to access are listed.It provides an overall view of the various sites managed by the monitoring platform. If you only have access to one site, the site’s dashboard is automatically displayed without going through the “Site” list on the top left of the Home Page.If you require access to additional sites, contact Customer Service Elum Energy.The Site Overview page is segmented into three parts, that will be detailed in the next section: – Left Sidebar (Part 2 – section 1) – Top bar (Part 2 – section 2) – Central Display Area (Part 2 – section 3)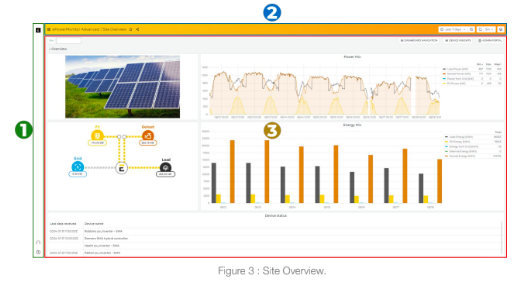
If you have more than one site assigned to you, the list of your sites will appear in the “Site” list on the top left of the Site Overview page.
If only one site is available, its dashboard will be automatically displayed without going through the “Site” list.
Brief Buttons Presentation


A. Homepage
Clicking this button will take you to a selection page where you can choose the versions of the monitoring platform that correspond to your subscription.

B. Profile
Displays a drop down menu with options to view and edit your profile, check notification history, change your password, and sign out.

C. Information Center
Clicking this button will take you back to the homepage. Hovering over it provides access to help guides, support contacts, privacy policy, terms & conditions, and platform version information.


A. Favorite:
Bookmarks a site for quick access, especially useful when monitoring multiple sites.

B. Share:
Access to sharing options.
![]()
C. Time range setting:
Allowing adjustment of the absolute time range for data visualization and time parameters.
![]()
D. Dashboard refresh:
Enables dashboard refresh using a predefined list of periods.

E. Full screen mode:
Enables full-screen mode for the platform.

The central display area presents and showcases site information, dashboards, and other essential elements.
PART 2 - Navigating the Site Overview
This section delves into the specific functionalities of buttons across the Site Overview page previously presented in section 3 of Part 1. It provides detailed insights into each button’s purpose and usage within ePowerMonitor, offering a comprehensive understanding of how to maximize operational efficiency and analytical capabilities.
Left Sidebar
1.A Homepage
Clicking this button will redirect you to the Homepage where you can select the appropriate version of the monitoring platform based on your site access. The available options will depend on the type of subscription associated with your account, as described in section 2 of Part 1.
1.B Profile
By clicking on the profile icon, you are taken to an account management page featuring three tabs:
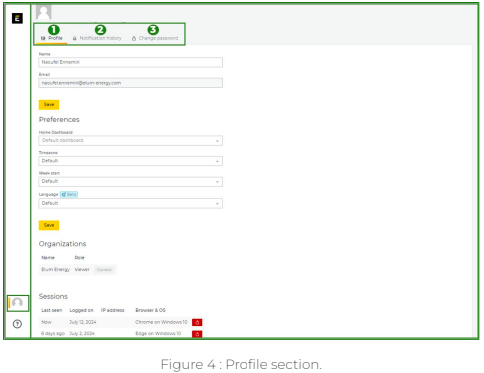
1. Profile management
Click on the profile icon located at the bottom of the left sidebar > click on Profile panel.
The profile tab allow you to view, update, and modify profile/site details, including:
- User name
- Preferences: You can set the following informations:
- Home Dashboard: Choose the dashboard displayed on the Homepage.
- Click on the profile icon located at the bottom of the left sidebar > click on Profile panel >Preferences > Home dashboard > Select the dashboard to display on the homepage.
- Timezone: Set the timezone for the selected site.
- Click on the profile icon located at the bottom of the left sidebar click on Profile panel >Preferences > Timezone > Choose your preferred time zone.
- Week start day: Allows you to choose the first day of the weekly cycle, such as Saturday, Sunday, or Monday.
- Click on the profile icon located at the bottom of the left sidebar click on Profile panel > Preferences > Weekstart > Choose from the dropdown list between “Saturday”, “Sunday”, or “Monday”.
- Language: Allows you to select the language in which the platform is displayed.
- Click on the profile icon located at the bottom of the left sidebar click on Profile panel > Preferences > Language > Choose from the dropdown list the language that suits you best.
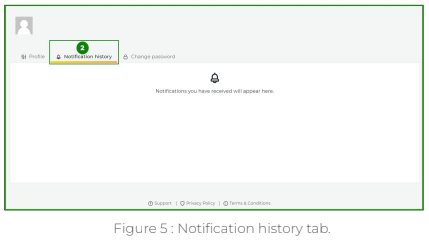
2. Notification history
Click on the profile icon located at the bottom of the left sidebar > click on Notification history panel
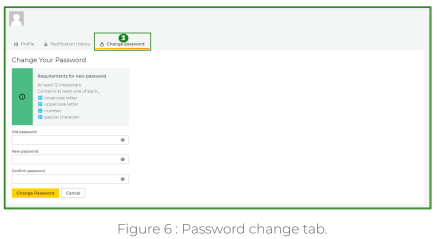
3. Change password: Allows you to modify your account password.
Click on the profile icon located at the bottom of the left sidebar > Change password > enter your new password.
Information Center
When hovering over it, a list of four options appears:
- Keyboard Shortcuts (for navigating the platform)
- Terms & Conditions
- Privacy Policy
- Support

Top Bar

- ePowerMonitor Version / Active tab: Indicates the version of the monitoring platform (ePM) you are using (LITE) and the currently selected view (active tab).
- Favorite: Click on the favorite icon in the yellow top bar of the Site Overview
page. - Export: The “Export” button opens a window with sharing options where you can:
Click on the share icon in the yellow top bar of the Site Overview page.
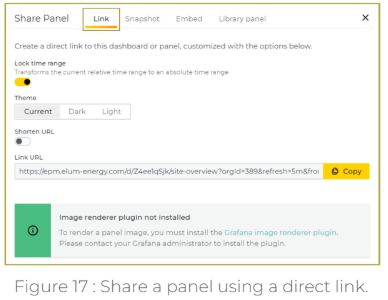
Option 1 – Create a direct link: Allow you to share the dashboard via a link, customized with the following options:
- Lock time range: Converts the current relative time range to an absolute
time range. - Choose the dashboard theme: Select the theme for the dashboard — current, dark, or light.
- Shorten the URL: Enable or disable URL shortening.
- Link to the URL: Provides the direct link.
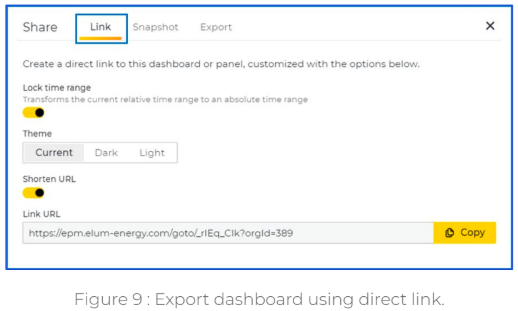
ℹ️ In order for the recipient of this link to access the dashboard, they must have access to your login credentials.
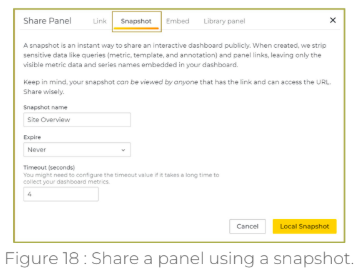
Option 2 – Create a Snapshot: Allows you to share an interactive dashboard publicly in an instant. When a snapshot is created, sensitive data like queries (metrics, templates, and annotations) and panel links are removed, leaving only the visible metric data and series names embedded in your dashboard.
The snapshot is accessible to anyone who possesses the link.
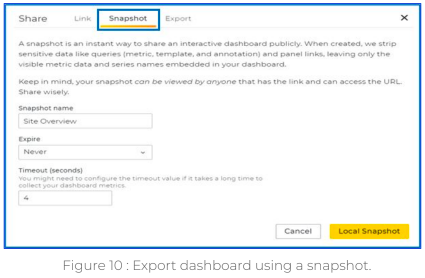
When selecting the ‘Snapshot‘ option, you have the following settings to configure:
- Snapshot name: Enter a name for the snapshot.
- Expiration duration: Choose how long the snapshot will be available — options include 1 hour, 1 day, 7 days, or never expire.
- Timeout (seconds): Adjust the timeout value if your dashboard metrics
take a long time to load.
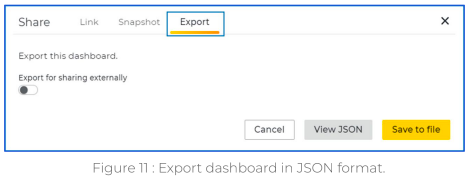
Option 3 – Export in JSON: Allow you to export the dashboard in a JSON format. When selected, you have the following options:
- Enable ‘Export for sharing externally’: If you’re exporting the dashboard to
use in another instance with different data source UIDs - View JSON: View the dashboard data in JSON format
4. Set time range for the graph data: This button allows to display the current time range and provides access to a detailed time range editing menu. The zoom-out button expands the time range
Click on the time range icon in the yellow top bar of the Site Overview page. > select preconfigured time intervals or enter your custom interval “from” “to”.
This window allows you to:
- Define the time range.
- Change time settings.

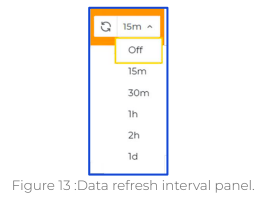
5. Refresh data: Updates the dashboard with the latest data and lets you set an
auto-refresh interval ranging from 15 minutes to 1 day.
Click on the refresh icon in the yellow top bar of the Site Overview page. > Choose from the list of refresh intervals ranging from 15 minutes to 1 day
6. Cycle view mode: Lets you to switch between different display modes:
This button works as follows:
- One click: Hides the left sidebar.
- Two clicks: Hides both the left sidebar and the top bar.
To exit this mode, press the “Esc” key.

Central Display Area
Standard functionalities across panels

Clicking on the top of a panel from the site overview reveals the following options:
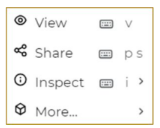
- View a panel: Clicking on “View” will expand the panel to occupy the entire window. To revert to the normal view, simply click on “Go Back” or press “Esc.”
- Share a panel: Clicking on “Share” will open a window with several sharing options:
Option A – Create a direct link: Allow you to share the dashboard via a link, customized with the following options:
- Lock time range: Converts the current relative time range to an absolute time range.
- Choose the dashboard theme: Select the theme for the dashboard — current, dark, or light.
- Shorten the URL: Enable or disable URL shortening.
- Link to the URL: Provides the direct link
ℹ️ In order for the recipient of this link to access the dashboard, they must have access to your login credentials.
Option B – Create a Snapshot: Share an interactive version of the dashboard publicly. Sensitive data such as queries and panel links are removed, leaving only visible metric data and series names. The snapshot can be accessed by anyone with the link.
Configure the following settings:
- Snapshot name: Enter a name for the snapshot.
- Expiration duration: Choose how long the snapshot will be available — options are 1 hour, 1 day, 7 days, or never expire.
- Timeout (seconds): Adjust if your dashboard metrics take a long time to load.
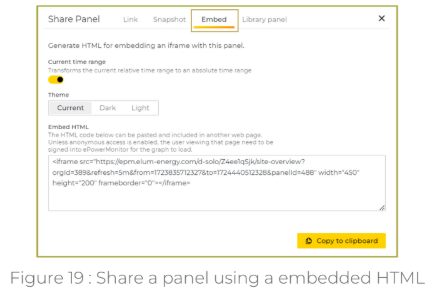
Option C – Embed: Generate HTML for embedding the panel in an iframe:
- Current time range (Enable/Disable): Converts the current relative time range to an absolute time range.
- Choose the dashboard theme: Select the theme for the dashboard — current, dark, or light.
- Embed HTML: Paste the provided HTML code into another web page. Users need to be signed into ePowerMonitor for the graph to load, unless anonymous access is enabled.
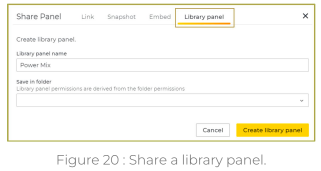
Option D – Library panel: Create a library panel by
- Creating a library panel name: Enter a name for the new library panel
- Choosing the folder: Select the folder where the panel will be saved. Library panel permissions are derived from the folder permissions.
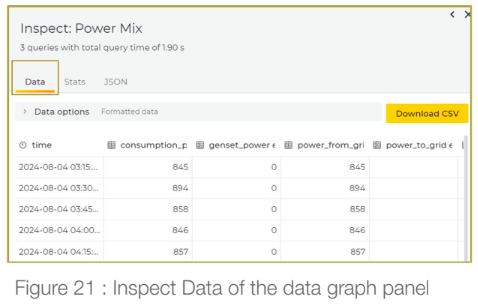
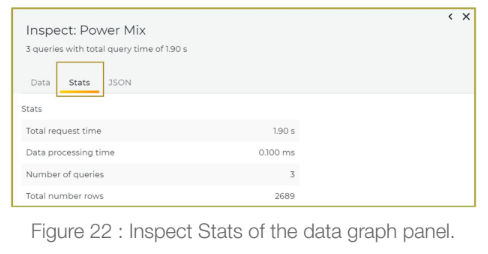
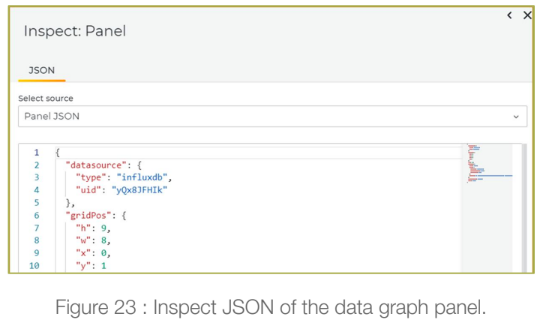
3. Inspect a panel: Clicking on “Inspect” opens a detailed analysis tool that is divided into three tabs: “Data,” “Stats,” and “JSON.” This tool is particularly useful if you need to delve deeper into the data being visualized, troubleshoot issues, or understand the underlying configurations.
- Data: Presents a table that lists all the data points currently displayed on the
dashboard, complete with their timestamps. It allows you to see exactly when each data point was recorded, offering a clear timeline of events. Additionally, the data can be easily exported as a CSV file for further analysis or reporting.
Stats: Provides insights into the performance of the data queries. It displays key metrics such as the total time taken to execute the queries, the duration of data processing, the number of queries made, and the total number of data rows returned.
JSON: Provides you with access to the raw data and configuration settings behind the dashboard. It offers three options:
- Panel JSON: Displays the configuration settings saved in the dashboard’s JSON, which controls how everything is set up and functions.
- Panel Data: Shows the raw data model that is passed to the panel for
visualization, giving insight into the input before any transformations are
applied. - Dataframe JSON (from query): Provides the unaltered data returned from
the query, before any transformations or field configurations have been
applied.
Full breakdown of Central Display Area panels
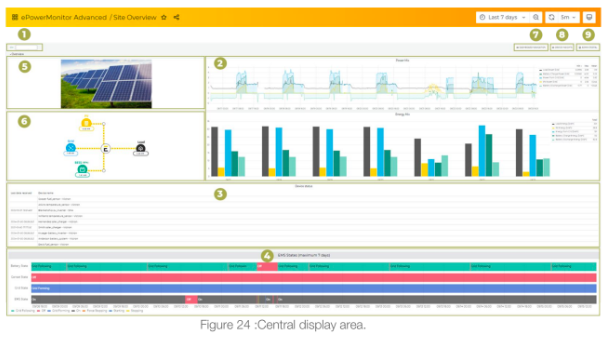
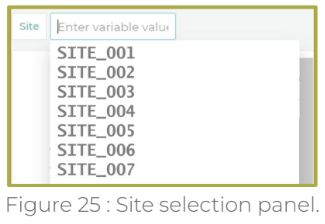
1. Site Selector: If you manage multiple sites to monitor, clicking this button will
display a dropdown list of the sites assigned to you.
Click on the “site” icon at the top left of the main display area > choose the site you wish to view from the scrolling list.
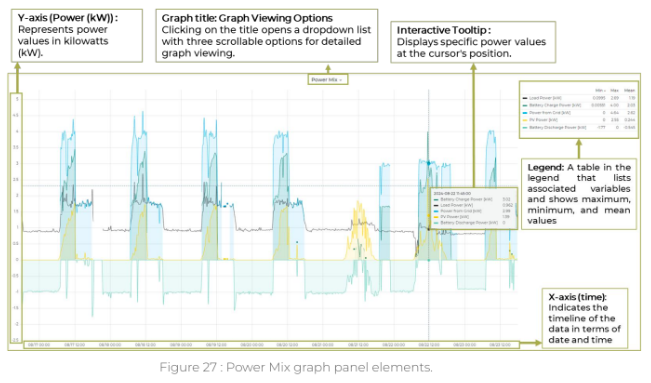
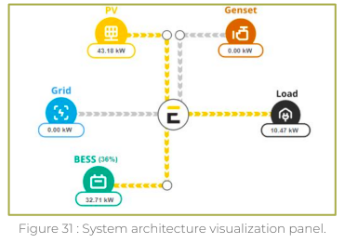
2. Data graph panels: Those panels feature a graphical representation of power data over time, illustrating various components of the system alongside customizable parameters. It allows you to visually track power trends and system performance metrics dynamically.

2. Power Mix graph: This line graph represents “Load Power” “Battery Charge Power” “Power from the Grid” “PV Power” and “Battery Discharge Power” all measured in kW over time and hours. It provides a visual comparison of these power sources and their fluctuations throughout the day.
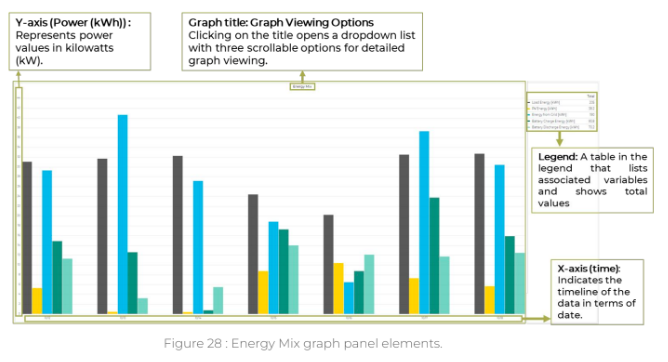
Energy Mix graph: This bar graph displays the total “Load Energy,” “PV Energy” “Energy from Grid” “Battery Charge Energy” and “Battery Discharge Energy” all measured in kWh, across different days. It offers a clear view of the energy distribution and consumption patterns over the selected period..
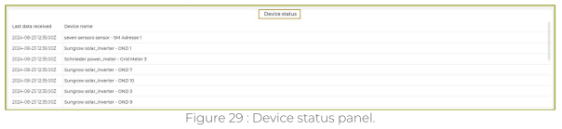
Custom Device View:
This feature enables you to monitor the status of devices at a selected site and check the timestamp of the most recent data received from them. The page also includes a graphical display that visualizes the measurements of the chosen devices.
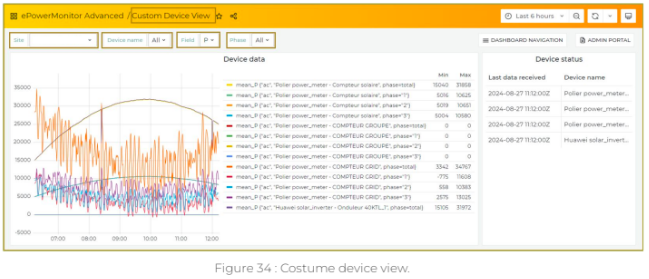
- Site Selection: You can select a specific site to view the device status, the last received data, and the graph associated with that site.
- Device name: You can choose a particular device to display its status, the last received data, and the corresponding graph.
- Field selection: A dropdown list allows you to select specific parameters they wish to display on the graph.
- Phase selection: A dropdown list enables you to choose the phase for which the measurements are to be displayed.
Portfolio Alerts Overview
This feature allows you to view the alert statuses and related aspects of various sites.
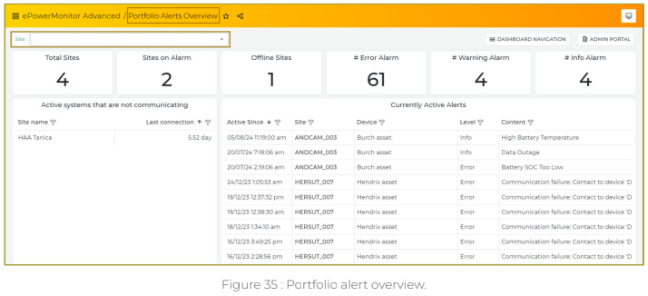
This page offers a comprehensive overview of the site’s alarms, including:
- Number of total sites displayed: Shows the total number of sites being monitored.
- Sites on alarms: Indicates the number of sites currently experiencing alarms.
- Number of offline sites: Displays how many sites are currently offline.
- Number of error alarms: Shows the count of critical error alarms.
- Number of warning alarms: Displays the number of warning-level alarms.
- Number of info alarms: Indicates the number of informational alarms.
- Tab for active systems not communicating: This section lists systems that are currently active but not communicating, including the site name and the date of the last connection.
- Currently active alerts: This section presents a detailed table of active alerts, organized into five columns: Active Since, Site, Device, Level, and Content. Each column provides specific information about ongoing alerts, including the duration since activation, the site and device involved, the severity level, and a brief description of the alert’s content.
Portfolio Real-Time status
Redirects you to a page featuring a 2D world map showing the sites assigned to you, precisely positioned according to their coordinates. Each site is marked with a colored point, which reflects its communication status based on the most recent data received: The map allows you to zoom in and out for a closer view of specific regions or sites.
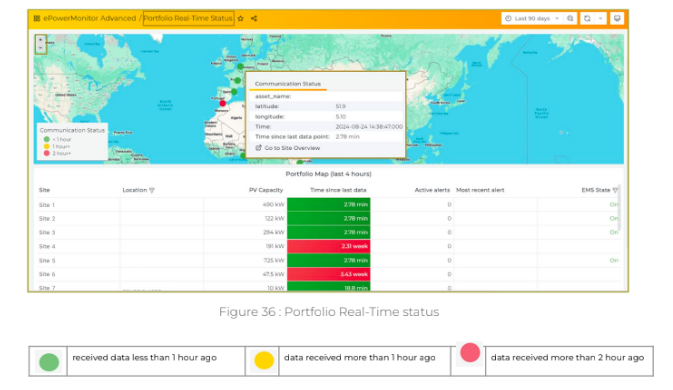
The map includes an interactive tooltip: when you hover your cursor over a site, site information such as the site name, location, and more is displayed.
Beneath the map, there’s a table with the following columns:
- Site: The name of the site.
- Location: The geographical location of the site.
- PV Capacity: The photovoltaic capacity of the site.
- Time since last data: How much time has passed since the last data communication.
- Number of active alerts: The current number of active alerts at the site.
- Most recent alert: Details of the most recent alert.
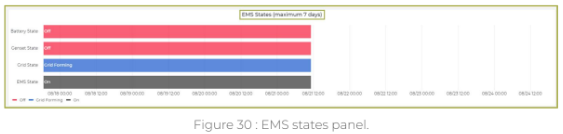
- EMS state: The current state of the Energy Management System (EMS) at the site ON/OFF.
You can access a site’s detailed overview in two ways:
- By clicking directly on the site from the map and then clicking on “Go to site Overview.”
- By selecting the site from the table located beneath the map.
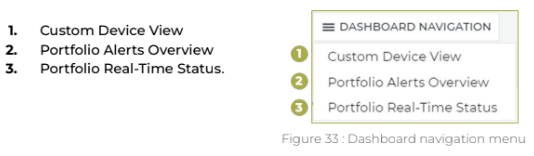
8. Device insights: Clicking the “Device Insights” button reveals a dropdown list with the following options:
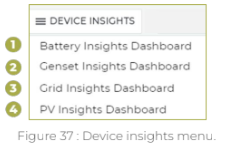
To navigate the Device Insights tab, please refer to section 3, Part 2.
1. Battery Insights Dashboard
You are directed to a page dedicated to battery performance and statistics, where you can view various KPIs and monitor the batteries from the following panels:
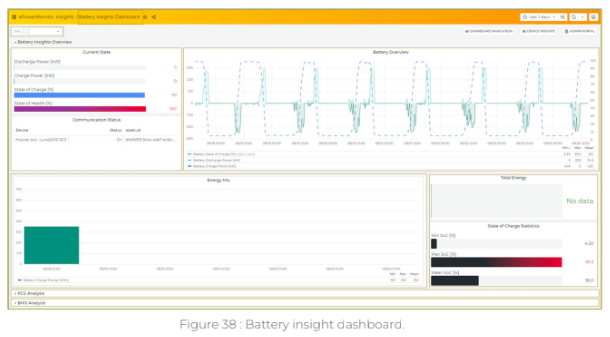
- Current State: Displays information on discharge power, charge power, and state of charge.
- Battery Overview: A graph that visualizes curves for the battery’s state of charge (M), battery discharge power (kW), and battery charge power (kW).
- State of Charge Statistics: Displays the minimum SOC, maximum SOC, and mean SOC.
- Total Energy: A panel that shows the total energy metrics.
- PCS Analysis: A group of graphs that displays various parameters including “active power per PCS,” “active power per phase,” “reactive power per phase,” “current per phase,” “voltage per phase,” “frequency per phase,” “power factor per phase,” and “PCS state of charge.”
- BMS Analysis: Provides insights into “BMS current” “BMS voltage,” “BMS state of charge,” and “BMS state of health.”
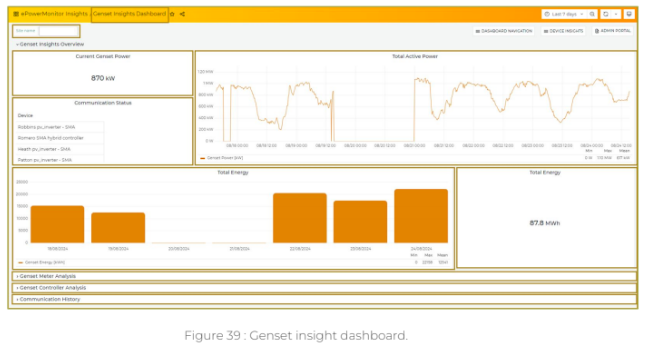
- Current genset power (kW): Displays the current power output of the genset in kilowatts.
- Total active power (kW): A graph that shows the curves for the genset’s total active power over time.
- Total energy graph: A bar chart that displays the total daily energy production over the past 7 days.
- Total energy: The cumulative energy produced by the gensets since they were commissioned.
- Genset meter analysis: A collection of graphs that provide detailed parameters from the genset meters, including “Runtime per hour”, “RPM”, “Communisation error code for each genset”,Active power per meter”, “Active power per phase”, “Reactive power per phase”, “Current per phase”, “Voltage per phase”, “Frequency per phase” and “Power factor per phase”
- Genset Controller Analysis: A set of graphs displaying various parameters related to the genset controllers, including “Genset controller status”, “Active power per meter”, “Active power per phase”, “Reactive power per phase”, “Current per phase”, “Voltage per phase”, “Frequency per phase” and “Power factor per phase”
3. Grid insights dashboard
You are directed to a page dedicated to grid performance and statistics, where you can view and monitor various KPIs through the following panels:
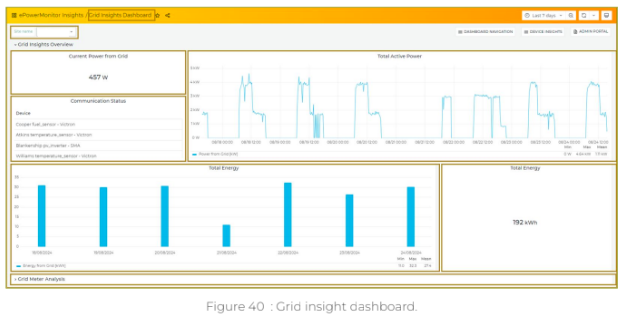
- Current power from the Grid (kW): Shows the current power being drawn from the grid in kilowatts.
- Total active power (kW): A graph that visualizes the curves of the grid’s total active power over time.
- Total energy graph: A bar chart displaying the total daily energy consumption from the grid over a period of 7 days.
- Total energy: The cumulative energy imported from the grid since the system was started.
- Grid meter analysis: A set of graphs providing detailed metrics from the grid meters, including:
○ Active power per meter
○ Active power per phase
○ Reactive power per phase
○ Current per phase
○ Voltage per phase
○ Frequency per phase
○ Power factor per phase
3. PV insights dashboard
You are directed to a page dedicated to PV performance and statistics, where you can view and monitor various KPIs through the following panels:
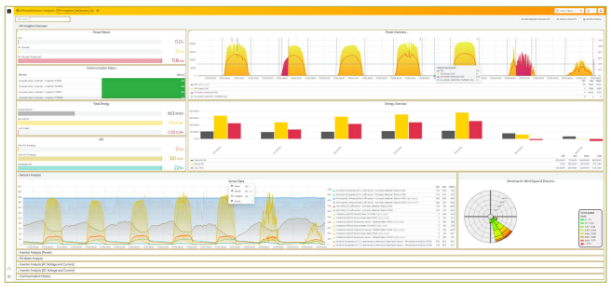
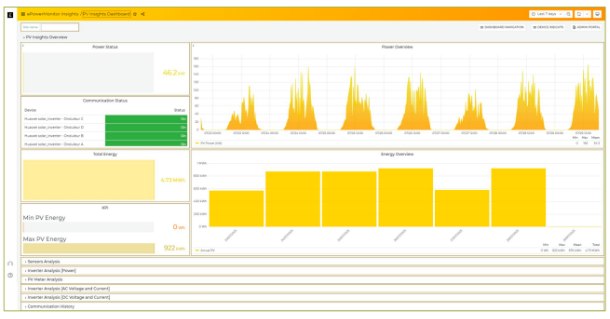
- Expected PV Production Power Status (W): Displays the real-time and anticipated power output of the PV system in watts (W), along with the PV potential for performance evaluation.
- Power Overview (kW): Visualizes the total PV power curves over time in kilowatts (kW), including actual production and PV potential comparison when available.
- Communication Status: Shows the live communication state of all connected inverters, indicating whether each device is online and transmitting data correctly.
- Energy Overview Graph: Provides a bar chart of daily energy production over the selected period, including potential PV, actual PV, and lost yield when sensor data is available.
- Total Energy: Displays the cumulative energy produced since commissioning, highlighting both actual PV generation and potential PV yield for performance tracking.
- KPI (Key Performance Indicators): Shows critical performance metrics such as minimum, maximum, and average PV energy, as well as PR (Performance Ratio) when calculated.
- Sensor Analysis: Presents detailed environmental data from site sensors, including irradiance, temperature, wind speed/direction, atmospheric pressure, and humidity,
Admin portal: Clicking on this button redirects you to view five panels specific to the site currently displayed on the Site Overview:
1. Assets panels
Click on “Admin portal” at the top right of the main display area > choose “Assets”.
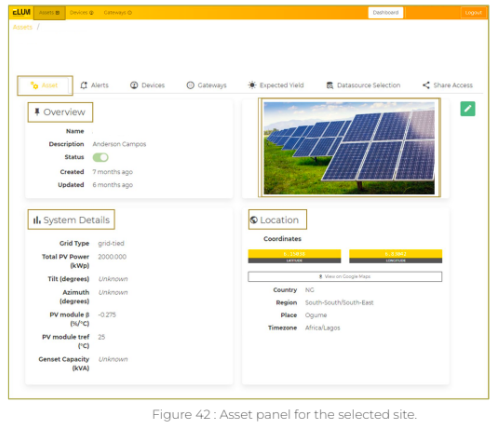
This panel is divided into four parts:
- Overview: Provides site details like name, IP address, status, creation date, and last update date.
- Image: Displays a visual representation of the site.
- System Details: Lists grid type, total PV power, tilt angle, PV module details, and genset capacity.
- Location: Includes coordinates, country, region, place, and timezone specifics.

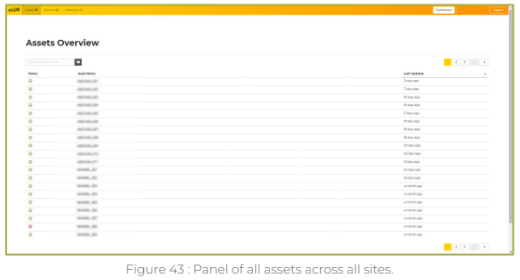
If you manage multiple sites, the global assets view allows you to select which columns to display, encompassing information from all sites.
2. Alerts panels
Click on “Admin portal” at the top right of the main display area > choose “Alerts”.
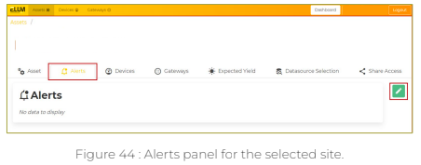
Create a new Alert
Click on “Admin Portal” in the top right corner of the main display area > Select “Alerts” from > Click on the pencil icon “Edit” > Click on “+New Alert”.
![]()
The following window will appear, allowing for the creation of a new alert:
- Alert Name: Define a name for the alert you wish to add.
- Severity: Select the alert severity from the dropdown list: Low, Medium, or High.
3. Condition:- Choose the device for which you want to set the alarm.
- Define the condition that will trigger the alarm.
- Alert channels: Provide the email address or communication channel where the alert message will be sent.
Click “Save” to finalize and add the new alert.
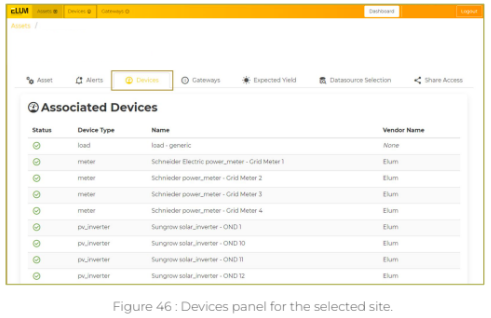
3. Devices panels
Click on “Admin portal” at the top right of the main display area > choose “Devices”. Opens a window titled ‘Associated Devices’ which displays a table containing details about the status, device type, name, and vendor for the selected site to monitor.
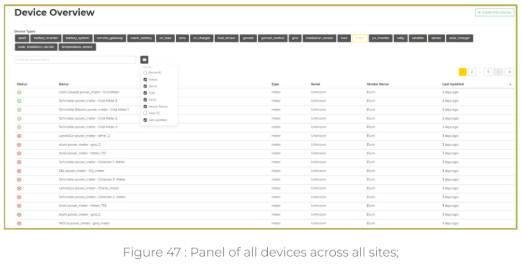
Clicking on the “Devices” section in the top bar allows you to view devices across all sites you have access to and provides comprehensive information about devices in all assigned locations. If you manage multiple sites, the global devices view lets you select which columns to display, such as Device ID, Status, Name, Type, Serial, Vendor Name, Asset ID, and Last Update.
Click on Admin Portal > Click on the Devices located at the top of the page in the yellow bar.
4. Gateways panels
Click on “Admin portal” at the top right of the main display area > choose “Gateways”.
Opens a window titled “Associated Gateways” which displays a table with columns for Gateway ID, last data received, and remote platform (Accessing eConf through your ePM platform is an optional feature.).

Gateway ID, Asset Name, Asset ID, Entity ID, Last Data Received, Last Updated, and Date of Creation

5. Share access
Click on “Admin portal” at the top right of the main display area > choose “Share access”.
The “Share access” tab allows you to control user access to the platform. You can add new access by entering user details and assigning access levels, and delete access by removing users from the system.
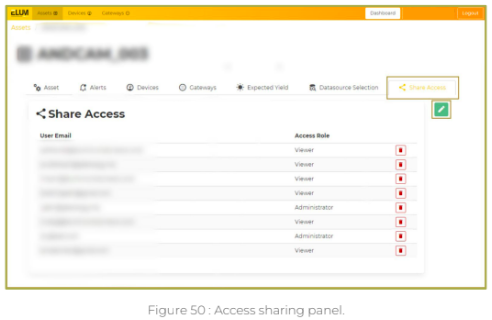
To manage access, simply use the options provided to add, configure, or remove users as needed.
Add new User Access
Click on “Admin Portal” in the top right corner of the main display area > Select “Share Access” > Click on the pencil icon “Edit” > Click on “+ New User Access”
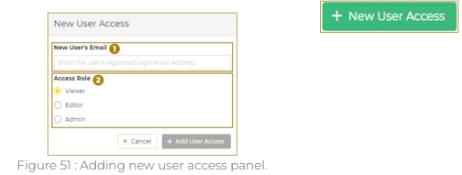
- New User’s Email: Enter the email address of the new user.
- Access Role: Specify the role for the new user
- Admin: Has full access rights
- Editor: Has the same rights as Admin, except for the ability to add new users
- Viewer: Can only view content, with no permissions to make changes
PART 3 - Annexes
1. Support Contact Information
For assistance with technical issues related to ELUM’s products, please contact us: Customer Service Elum Energy
Before reaching out, ensure you have the following information ready:
- The model and serial number of the product in question.
- The error code displayed on the eConf platform or indicated by LEDs, if available.
- Details of the system configuration.
Lastly, verify that the product in question is connected to the internet and that your site has an active internet connection.
2. Disclaimers
The content of these documents is continually reviewed and amended as necessary. However, discrepancies cannot be excluded, and no guarantee is made for the completeness of these documents. The content of this document can be edited by Elum Energy, and the English version prevails if any discrepancy appears in a translated version.
The material furnished in this document is believed to be accurate and reliable. However, Elum Energy assumes no responsibility for its use. Elum Energy reserves the right to make changes to the material at any time and without notice. For the most updated version, please refer to the Elum Energy website (www.elum-energy.com).
The company Elum SAS, whose registered office is located at 9 rue d’Enghien – 75010 PARIS and registered with the Paris Trade and Companies Registry under number 817 860 083, integrates and distributes monitoring and control panels for photovoltaic and hybrid installations marketed under the names “ePowerLog” and “ePowerControl,” as well as a monitoring web platform marketed under the name “ePowerMonitor.”
The purpose of this manual is to provide users with all the necessary information to set up and use the ePowerMonitor platform. For instructions regarding ePowerControl and ePowerLog products, please refer to their dedicated User Manuals. This document is intended for anyone involved in the monitoring, operation, and maintenance of a power system using Elum equipment. The following symbols will assist the reader in navigating through the document by highlighting important information from the general text: