Homepage > ePowerMonitor
ePowerMonitor
Manage and control solar energy production with a hypervision platform tailored for multi-energy sites.
Why choose ePowerMonitor?
ENSURE PERFORMANCE
VALUE YOUR SOLAR SITE
Help building owners share information on solar sites in front of clients or employees through a dedicated end-client overview.
INCREASE PLANT REVENUE
Provides Asset Managers with an analysis of the causes of plants underperformance to increase KWh produced
REDUCE DOWNTIME
Accelerate site diagnosis through alarms & advanced KPI’s – quickly implement corrective actions via remote control.
AUTOMATE REPORTS
Help Asset Managers provide accurate financial reports through advanced production KPIs (e.g. PR)
Energy Monitoring Software for Comprehensive Site Visibility
Site autonomy becomes achievable with the right tools. Our energy monitoring software, with advanced monitoring and controller integration, delivers actionable insights, automated control, and seamless energy management tailored to your site’s needs.
on the market. Up to 200 devices per dataloggers
the connection is available again
Advanced Features for Analysis and Reporting
Features designed to achieve energy autonomy
Data monitoring
Performance analysis
Portfolio overview
Reporting and data export
Anomaly detection
Custom dashboards
One Tool, Multiple Users
O&M TEAM
Access to site performance KPI
Display of variables per equipment or string of solar inverters
Customizable alarms
Display of alarm logs and status of solar equipments
Alarm configuration & email notification
ASSET MANAGER
Access to production KPI
Estimation of theoretical production vs real production, performance ratio KPI
Access to Remote eConf
Check and update portfolio set up remotely anytime
BUILDING OWNER
Access to production KPI
Estimation of real solar production
Access to live overview
Overview of production assets with a visual display of all the equipments on site
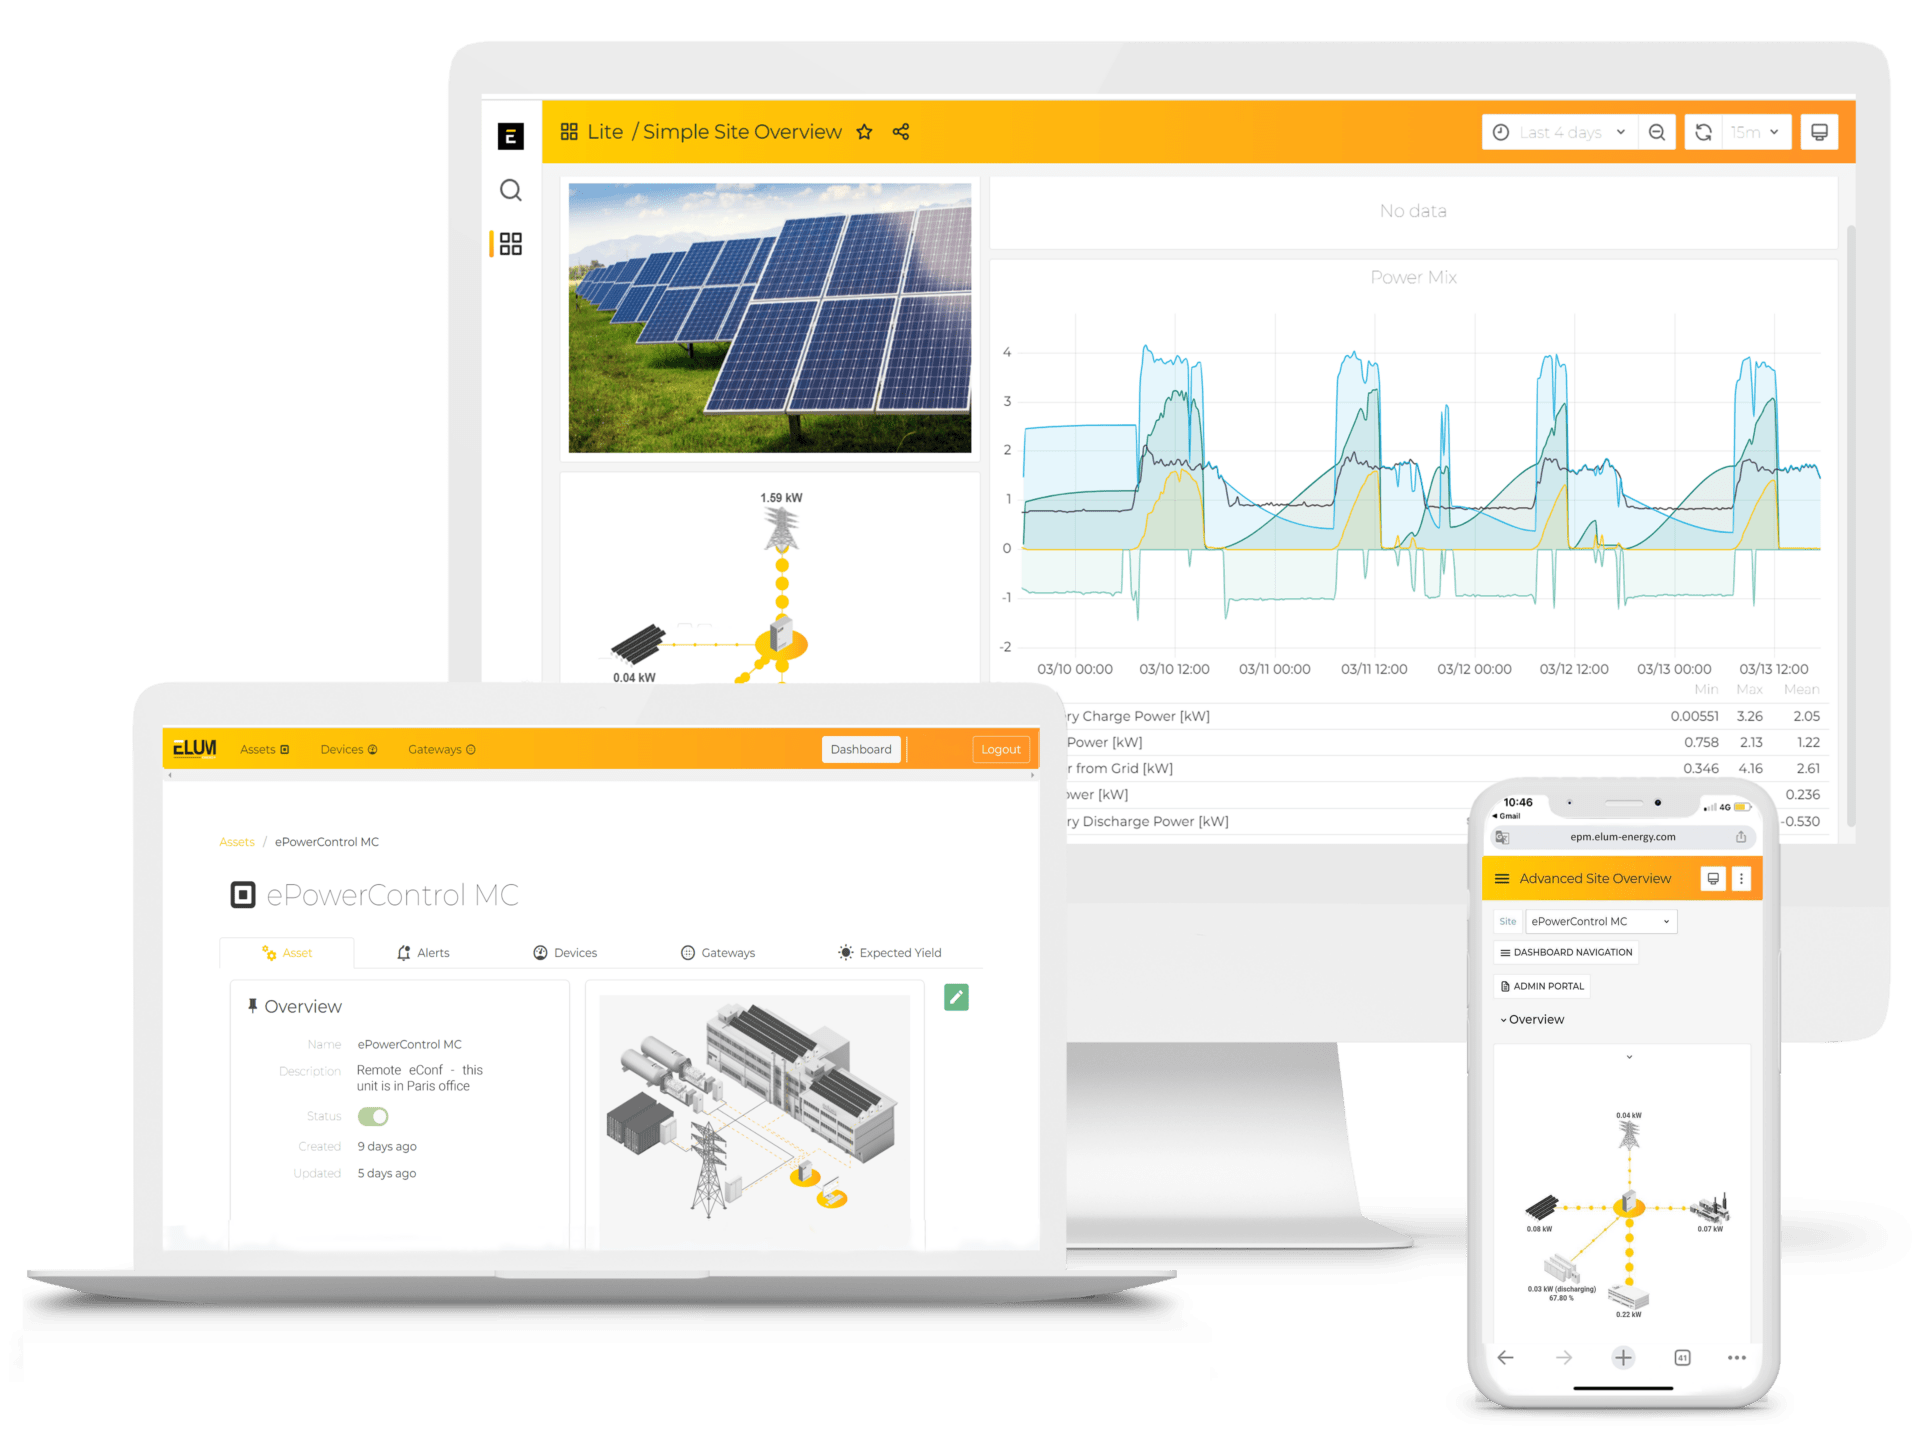
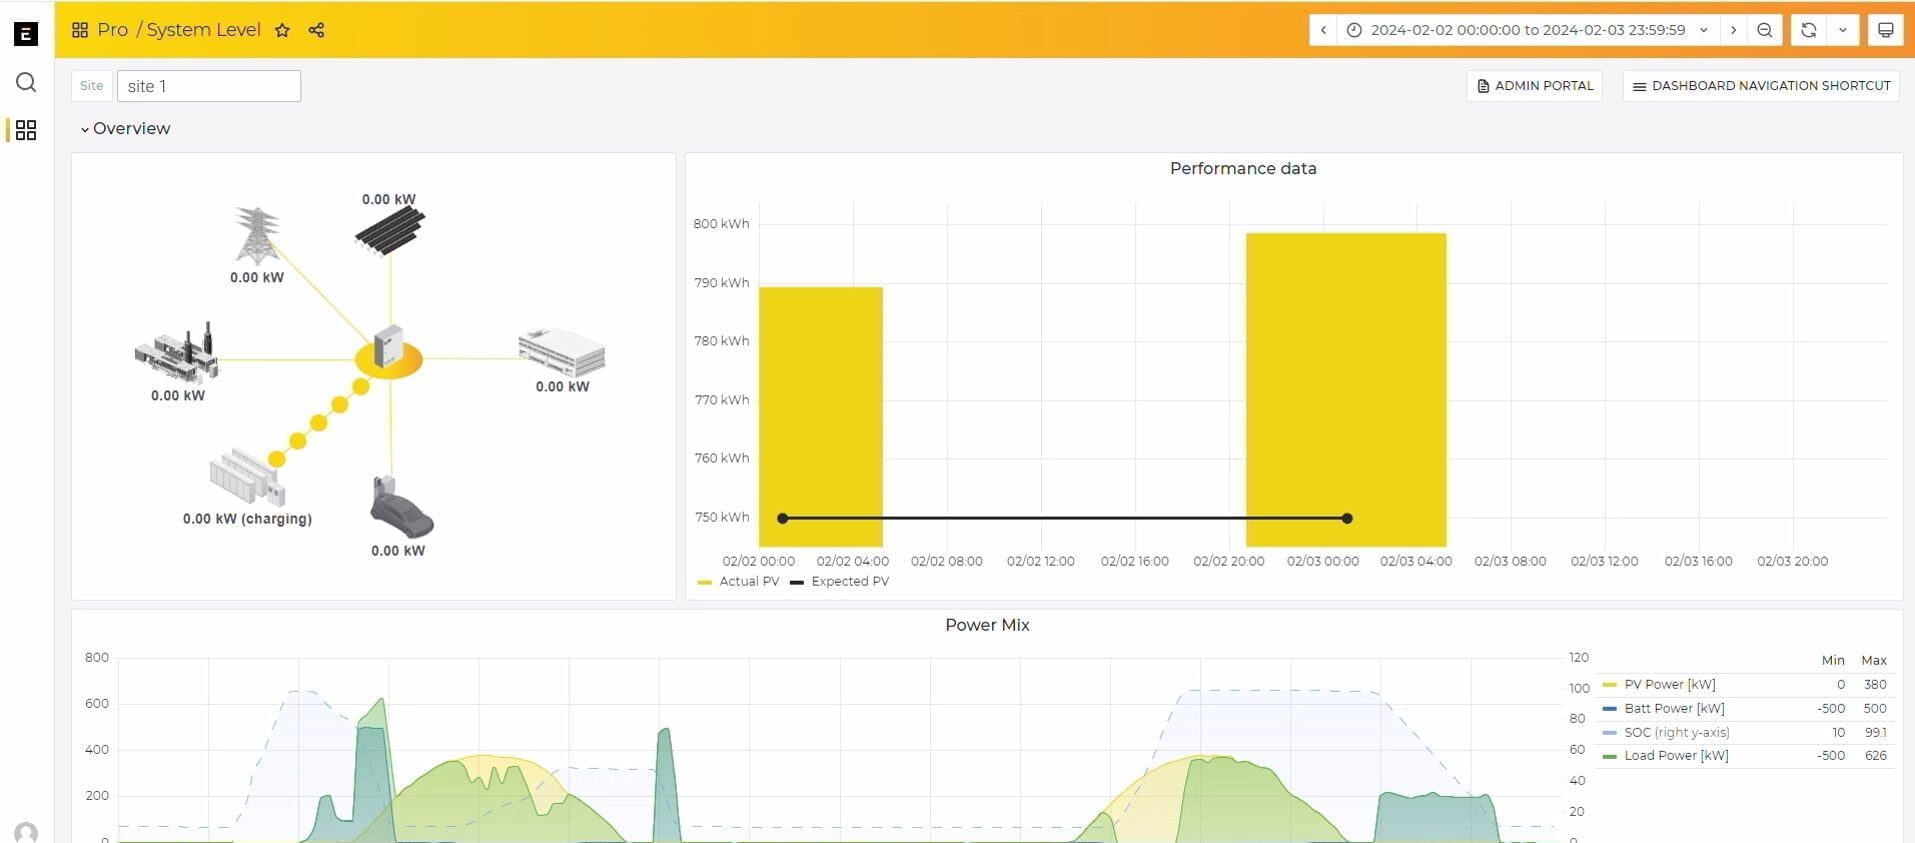
Flexible Platform Available in Two Versions
Multiple plan options available to match your site’s unique needs.
✓ Includes:
- Corporate logo or site picture
- Power mix (kW)
- Most recent data (kW)
- Remote eConf access – optional
- Data granularity – 10 mins
- Export methods – CSV
- Max. number of users – 2 users
✗ Not included:
- Energy mix (kWh)
- Portfolio real time view
- Devices list
- Devices communication status
- EMS state
- Grid insights dashboard
- Genset insights dashboard
- PV insights dashboard
- Sensors insights dashboard
- Battery insights dashboard
- Alerts configuration
- Alerts overview dashboard
✓ Includes:
- Corporate logo or site picture
- Power mix (kW)
- Energy mix (kWh)
- Most recent data (kW)
- Portfolio real time view
- Devices list
- Devices communication status
- EMS state
- Grid insights dashboard
- Genset insights dashboard
- PV insights dashboard
- Sensors insights dashboard
- Battery insights dashboard
- Alerts configuration
- Alerts overview dashboard
- Remote eConf access – optional
- Data granularity – 1 / 5 / 10 mins
- Export methods – CSV or API
- Max. number of users – 10 users
Frequently Asked Questions
What is the time limit to collect data?
There is no time limit for fetching data. Data available on the platform can be exported for any selected period, ranging from 2 days to 5 years, depending on data availability.